Below are T-LogoQube files available for public use. To use any of these resources please credit the T-LogoQube team at Sonoma State University/ Morehead State University.
RFM22B - datasheet
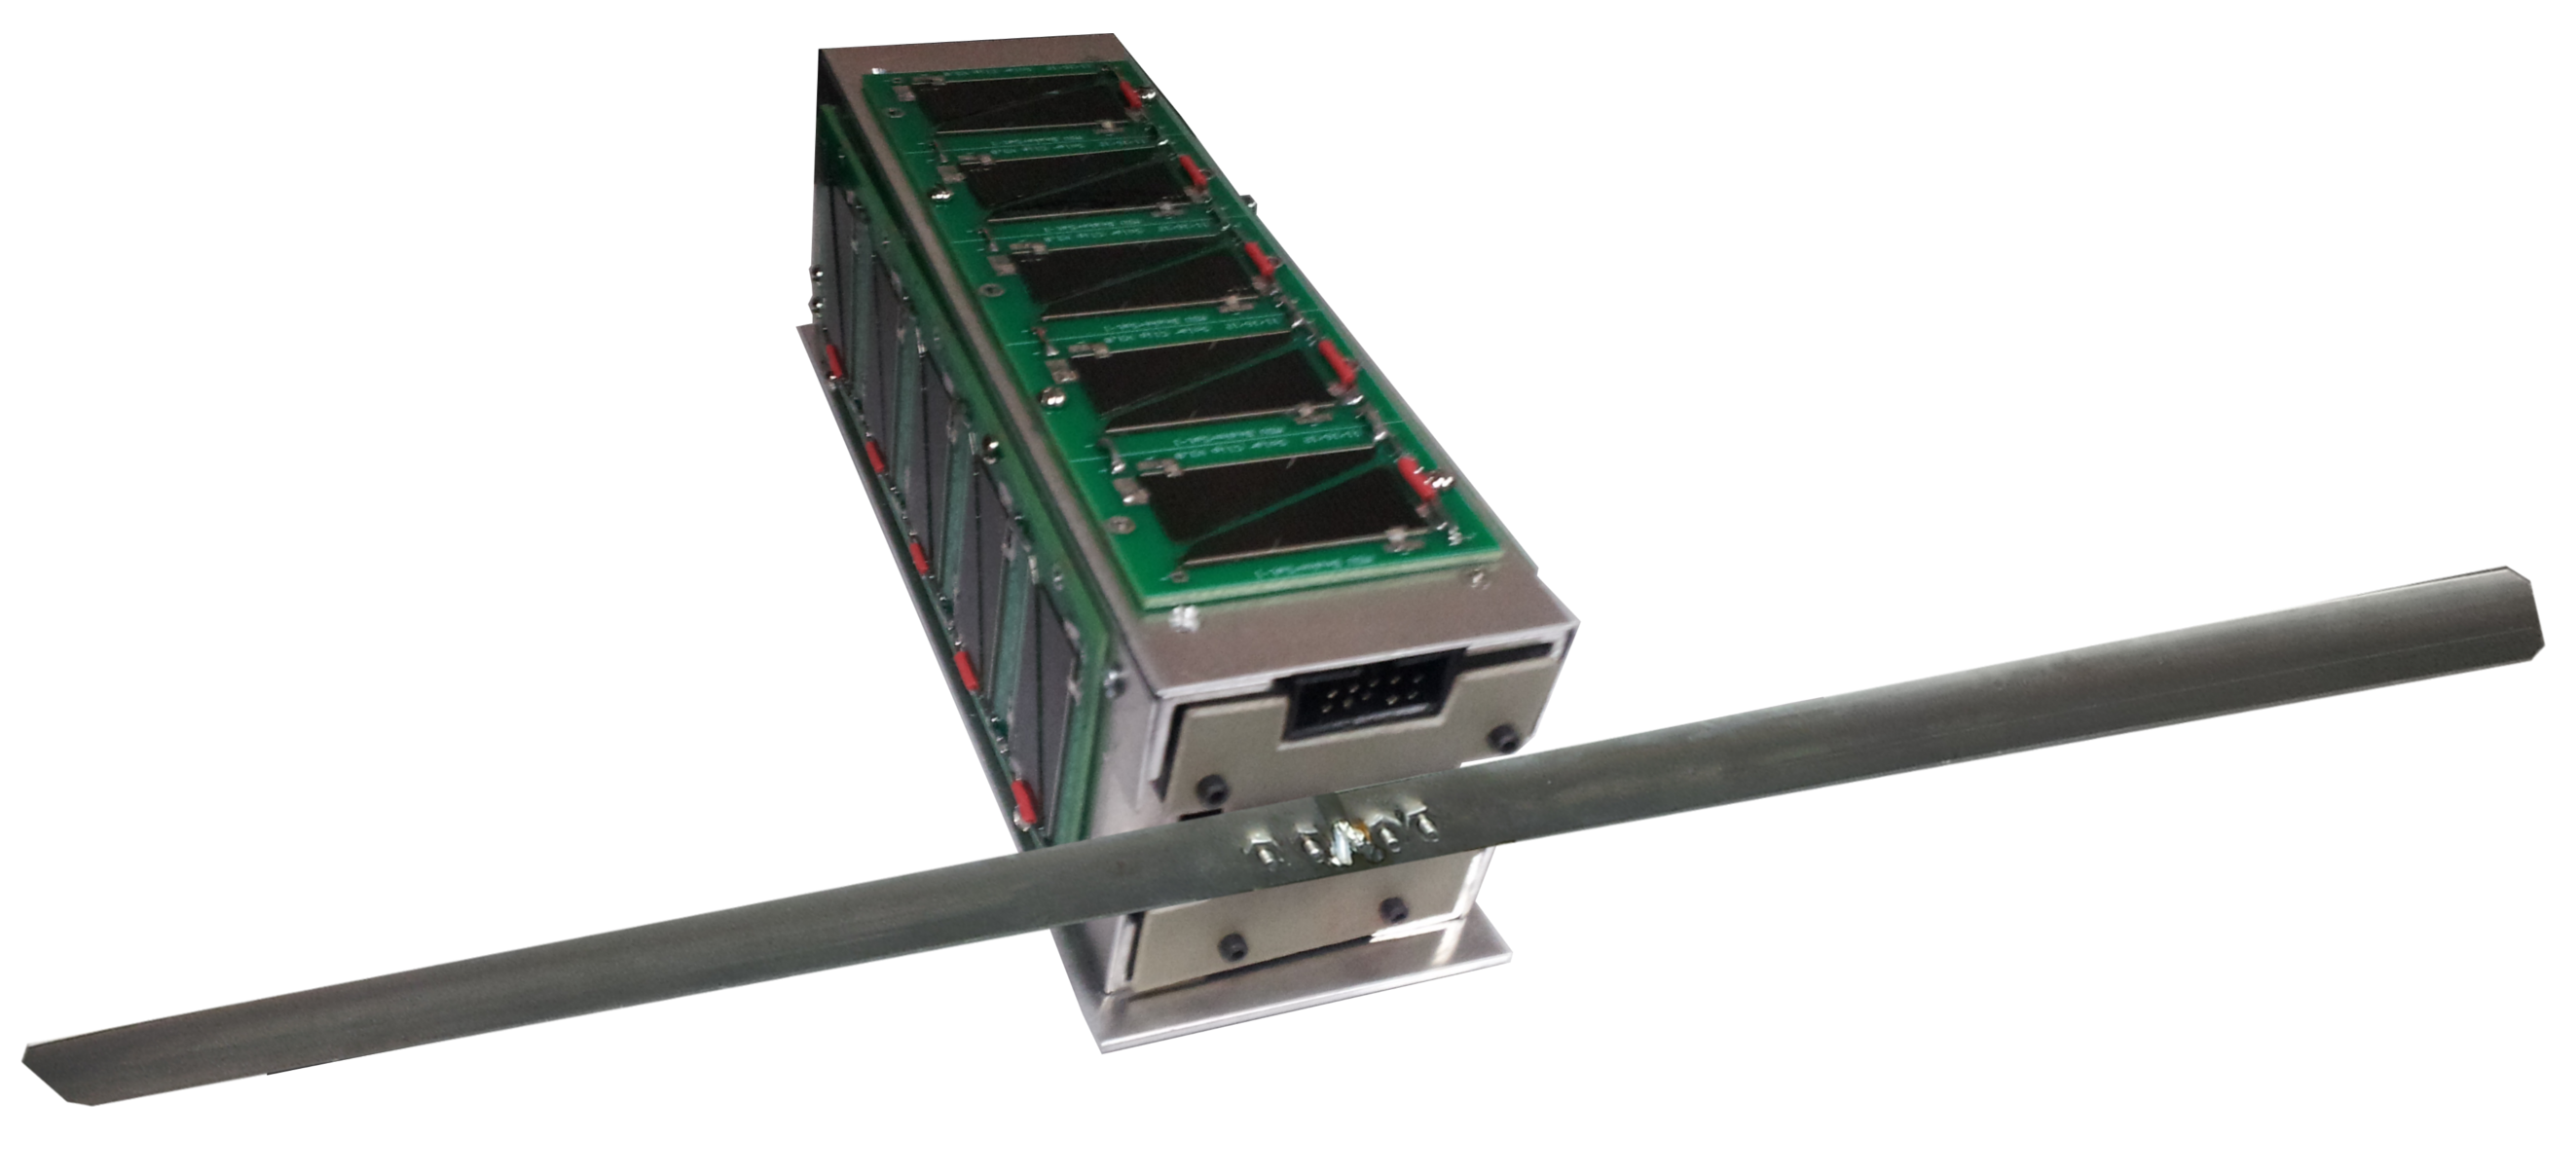
Satellite - Image of the T-LogoQube Satellite
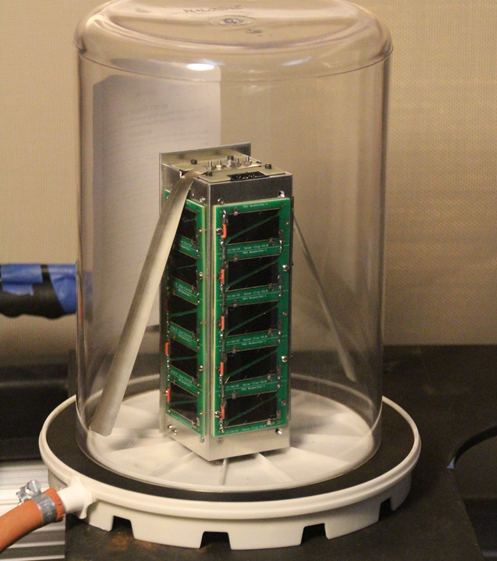
T-LogoQube in Vacuum - T-LogoQube being tested in Vacuum Chamber at SSU
T-LogoQube Unisat 5 - T-LogoQube being installed into into the MR-FOD launcher in UniSat-5 in Italy
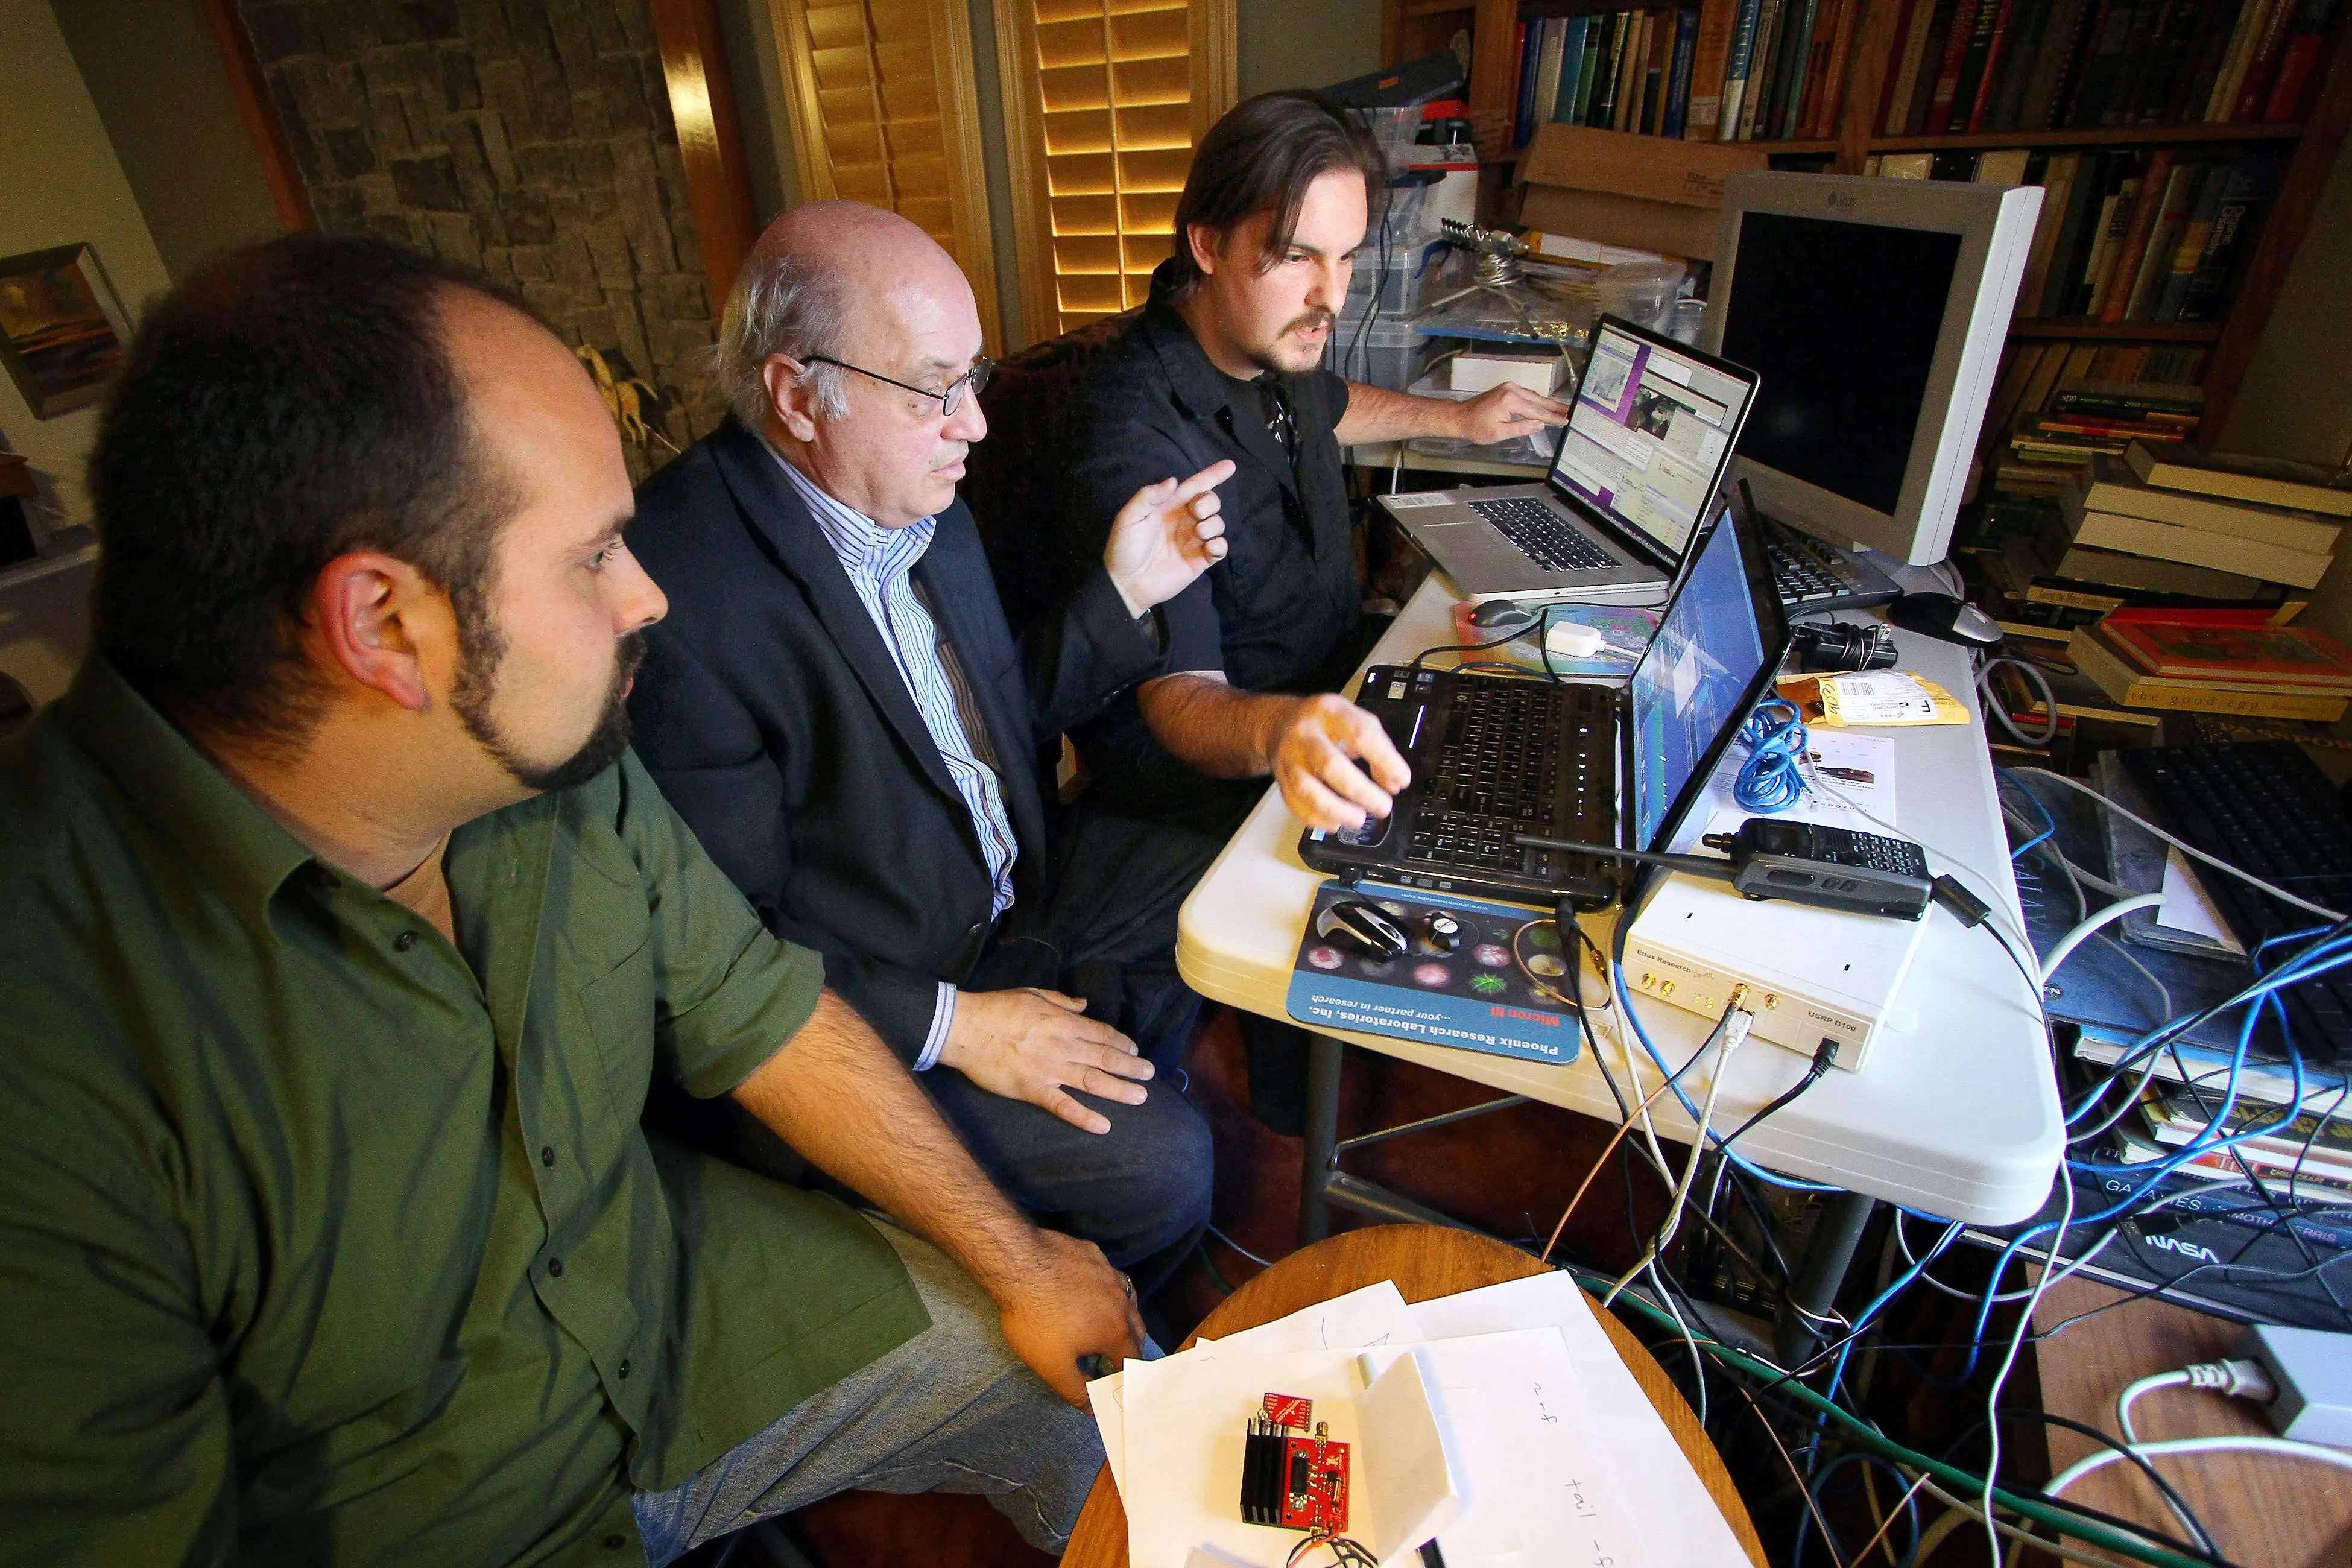
Sean McNeil - Sean McNeil in Italy preparing to install T-LogoQube into UniSat-5. He is listening to the 70 cm Ham Receiver for the beacon packets.
First Beacon Packets from T-LogoQube (Labels / No Labels) - Caption: First four beacon packets from T-LogoQube (horizontal axis = frequency; vertical axis = time) Packets arrive every ~20 seconds. Each packet appears in the waterfall plot as a pair of points at two frequencies ~437.465 +- 0.012 MHz. The tilt of the pattern is caused by the Doppler shift from higher to low frequencies as T-LogoQube passes over head. The tilted signals on the right side of the waterfall plot are from a different satellite.
Commanded Data Dump from T-LogoQube (Labels / No Labels) - Caption: This waterwall plot shows a sequence of beacon packets saved in the memory onboard T-LogoQube over a ~3 hour period that was commanded from the ground to dump in real time as T-LogoQube passed over head. The tilt of the packets is due to the Doppler shift. The periodic dimming and of the signal is due to the spin of T-LogoQube. The vertical lines are terrestrial radio sources near the Little H-Bar Ranch in Petaluma (no Doppler shift).
Group Photo - SSU team at the Little H-bar Ranch with the Yagi antenna. Hunter Mills, Ben Cunningham, Kevin Zack (student leader), Steve Anderson (SSU equipment technician), Aaron Pacheco, Garrett Jernigan and Lynn Cominsky
T-LogoQube Paper Model (Instructions - print on 8.5 x 11 paper)
T-LogoQube - Model Parts (print in color on 11 x 17 cardstock)